


In 2017, China's macro environment continued to improve, domestic demand stabilized and recovered, external demand gradually recovered, the pace of structural adjustment, transformation and upgrading accelerated, and the production and business environment of enterprises was significantly improved。The electronic information manufacturing industry has achieved rapid growth, the growth rate of production and investment has maintained a leading level in industrial industries, the export situation has improved significantly, and the efficiency and quality have continued to improve。
1. Production situation
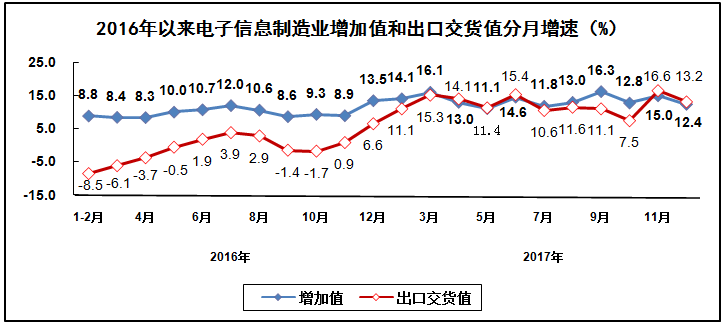
Production has maintained rapid growth。In 2017, the added value of the electronic information manufacturing industry above designated size increased by 13 percent over the previous year.At 8%, the growth rate is 3. 3 percent faster than in 2016.Eight percentage points;It is faster than the growth rate of all industrial enterprises above designated size.2 percentage points, accounting for the proportion of industrial added value above designated size is 7.7%。Among them, the growth rate in December was 12.4 percent, down 2 percent from November.Six percentage points。
The export situation has improved。In 2017, the value of export deliveries increased by 14.2 percent (down from 0.1%), faster than the growth rate of all industrial export delivery value above designated size3.5 percentage points, accounting for the proportion of industrial export delivery value above the scale of 41.4%。Among them, the export delivery value in December increased by 13.2 percent, down 3 percent from November.Four percentage points。
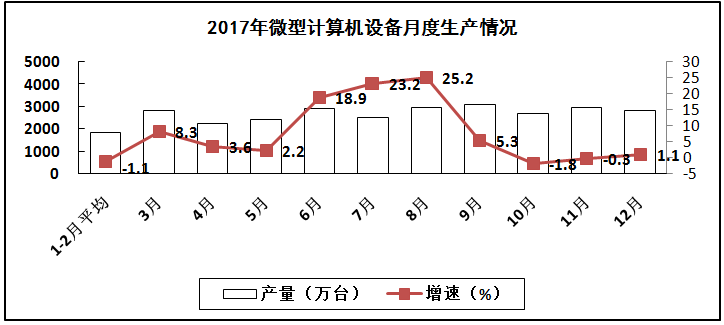
The production and export of computer industry improved significantly。In 2017, 306.78 million units of microcomputer equipment were produced, an increase of 6 percent over the previous year.8 percent (down 9.6%), including 172.44 million laptops, an increase of 7 percent over the previous year.0%;Tablet computers 86.28 million units, an increase of 4.4%。Export delivery value increased by 9.7 per cent (down 5 per cent in 2016.4%)。
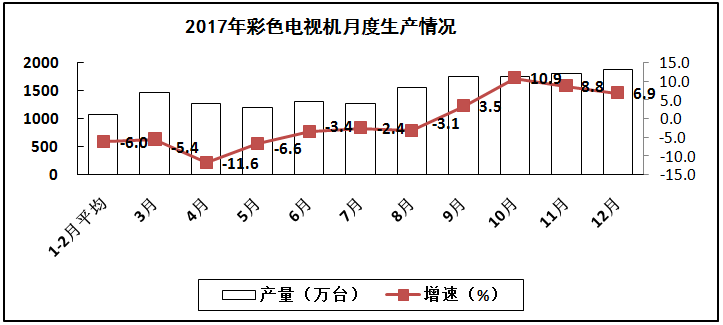
Home audiovisual industry production continues to be depressed, export growth accelerated。In 2017, 172.33 million color TV sets were produced, an increase of 1 million over the previous year.6 percent, down 7 percent from 2016.1 percentage point;Among them, LCD TV set 16.901 million units, an increase of 1.2%;Smart TVS 109.31 million units, an increase of 6 over the previous year.9%, accounting for 63 percent of color TV production.4%。Achieved export delivery value over the previous year increased by 11.8%, an acceleration of 10 percentage points year-on-year。
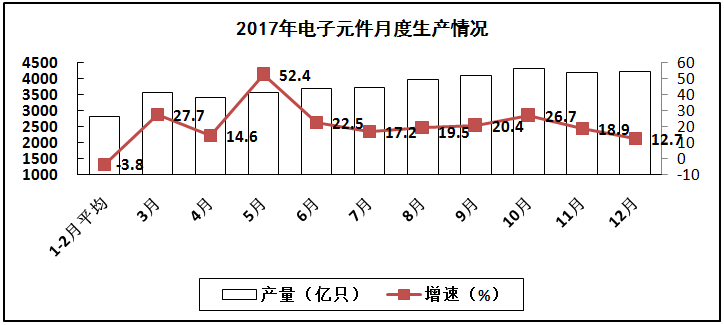
The production of electronic components industry increased steadily, and the export growth rate accelerated。In 2017, 4,407.1 billion electronic components were produced, an increase of 17 percent over the previous year.8%。Export delivery value increased by 20 percent over the previous year.7 percent, 18 percent faster than in 2016.One percentage point。
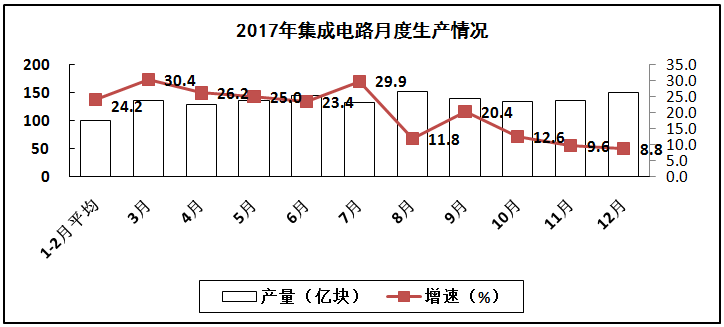
The production and export of electronic devices industry have achieved rapid growth。In 2017, 156.5 billion pieces of integrated circuits were produced, an increase of 18 percent over the previous year.2%。Export delivery value increased by 15 % over the previous year.1 percent (down from 0.7%)。
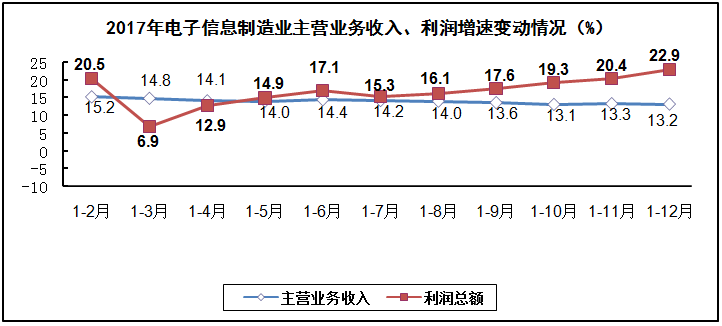
Industry efficiency continued to improve。In 2017, the main business income of the whole industry increased by 13 percent over the previous year.2 percent, 4 percent higher than in 2016.Eight percentage points;Profit increased by 22 percent over the previous year.9%, an increase of 10% over 2016.One percentage point。The profit margin of main business income is 5.16%, an increase of 0. 0% over the previous year.41 percent;Enterprise loss 16.4%, an increase of 1% over the previous year.7 percentage points, the total loss of loss-making enterprises decreased by 4 percent over the previous year.6%。At the end of 2017, the industry-wide accounts receivable increased by 16 percent over the previous year.4%, higher than the main business revenue growth in the same period 3.2 percentage points;Finished goods inventories were up 10 percent over the previous year.4%, the growth rate accelerated year-on-year by 7%.Six percentage points。
Investment in fixed assets
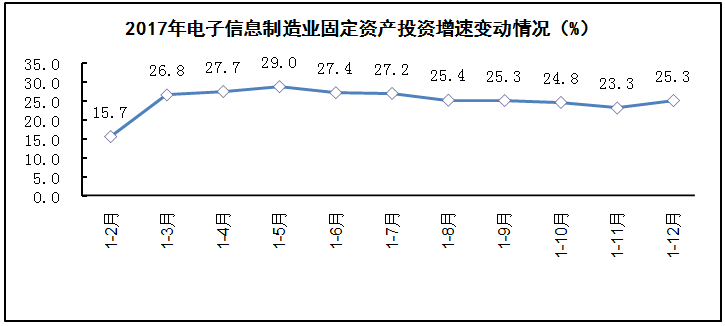
Investment in fixed assets maintained rapid growth。In 2017, the investment in fixed assets completed by projects above 5 million yuan in the electronic information manufacturing industry increased by 25 percent over the previous year.3 percent, which is 9 percent faster than in 2016.5 percentage points, maintaining a high growth rate of more than 20% for 10 consecutive months。Electronic information manufacturing industry this year new fixed assets increased by 35.3 percent (down 10 percent in 2016).9%)。
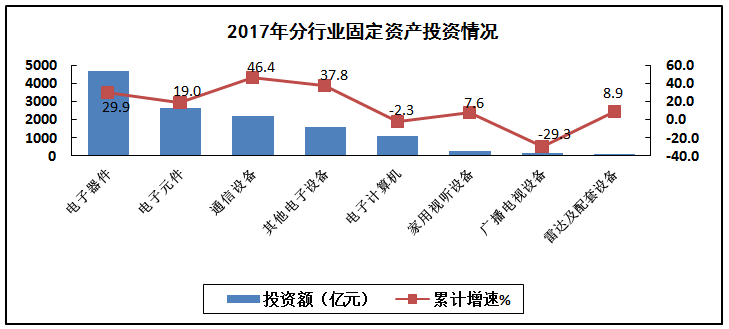
Communication equipment, electronic devices industry investment growth is prominent。In 2017, the investment in communication equipment in the whole machine industry grew rapidly, and the completed investment increased by 46 percent over the previous year.4%, an increase of 16 percent year-on-year.1 percentage point;Home audiovisual industry completed investment increased by 7.6%;Completed investment in the computer industry was down 2. 2 percent from the previous year.3%。The electronic device industry completed investment increased by 29 percent over the previous year.9%;The completed investment in the electronic components industry increased by 19 percent over the previous year.0%。
The investment of domestic enterprises grew rapidly。In 2017, the completed investment of domestic enterprises increased by 29% over the previous year.Among them, state-owned enterprises and limited liability companies grew faster, with a growth rate of 40 percent respectively.5%和32.5%。Investment by Hong Kong, Macao and Taiwan enterprises increased by 10 percent over the previous year.5%。The completed investment of foreign-invested enterprises increased by 13% over the previous year.7%。
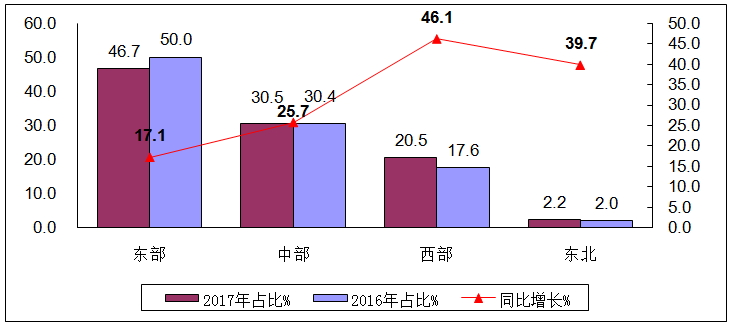
Investment growth in the western region led the way, while investment in the northeast region improved significantly。In 2017, investment in the eastern region grew steadily, and completed investment increased by 17 percent year-on-year.1%, the growth rate is 1 percent lower than in 2016.Among them, the investment in Hebei and Guangdong grew faster, increasing by 46 percent respectively.4%和41.9%;Investment in the central region grew rapidly, and completed investment increased by 25 percent year-on-year.7 percent, an increase of 11 percent over 2016.Among them, the investment in Jiangxi and Anhui grew faster, increasing by 76 percent respectively.2%和24.6%;The western region led the growth of investment, with a year-on-year increase of 46 percent.1 percent, an increase of 26 percent over 2016.Investment in Yunnan, Guizhou and Sichuan grew faster, with a year-on-year increase of 338.9%、120.9%和118.0%;Investment in Northeast China turned from a decline to an increase of 39 percent year-on-year.7 percent (down 29 percent in 2016).Investment in Heilongjiang and Liaoning increased by 109 percent respectively.7%和60.8%。